




Scaling Marketing Output Without Scaling Headcount: A Capacity Model You Can Run in a Spreadsheet
Every December, the planning deck says it: twice the output next year, same team. Nobody has a number that says whether that's possible. The marketing lead suspects it isn't, and can't show why beyond "we're already stretched."
At Bespire, we run creative production for marketing teams: a Success Manager who gets each request ready, a creative team that makes it, and one platform where it all stays connected. Planning capacity across many client queues at once has taught us one thing about scaling marketing: output is capped by capacity and workflow, not by ideas. And most teams have never measured either.
Here's how to measure both with four numbers, a free spreadsheet, and four levers that move the cap.
Why channel-first scaling advice quietly assumes infinite production
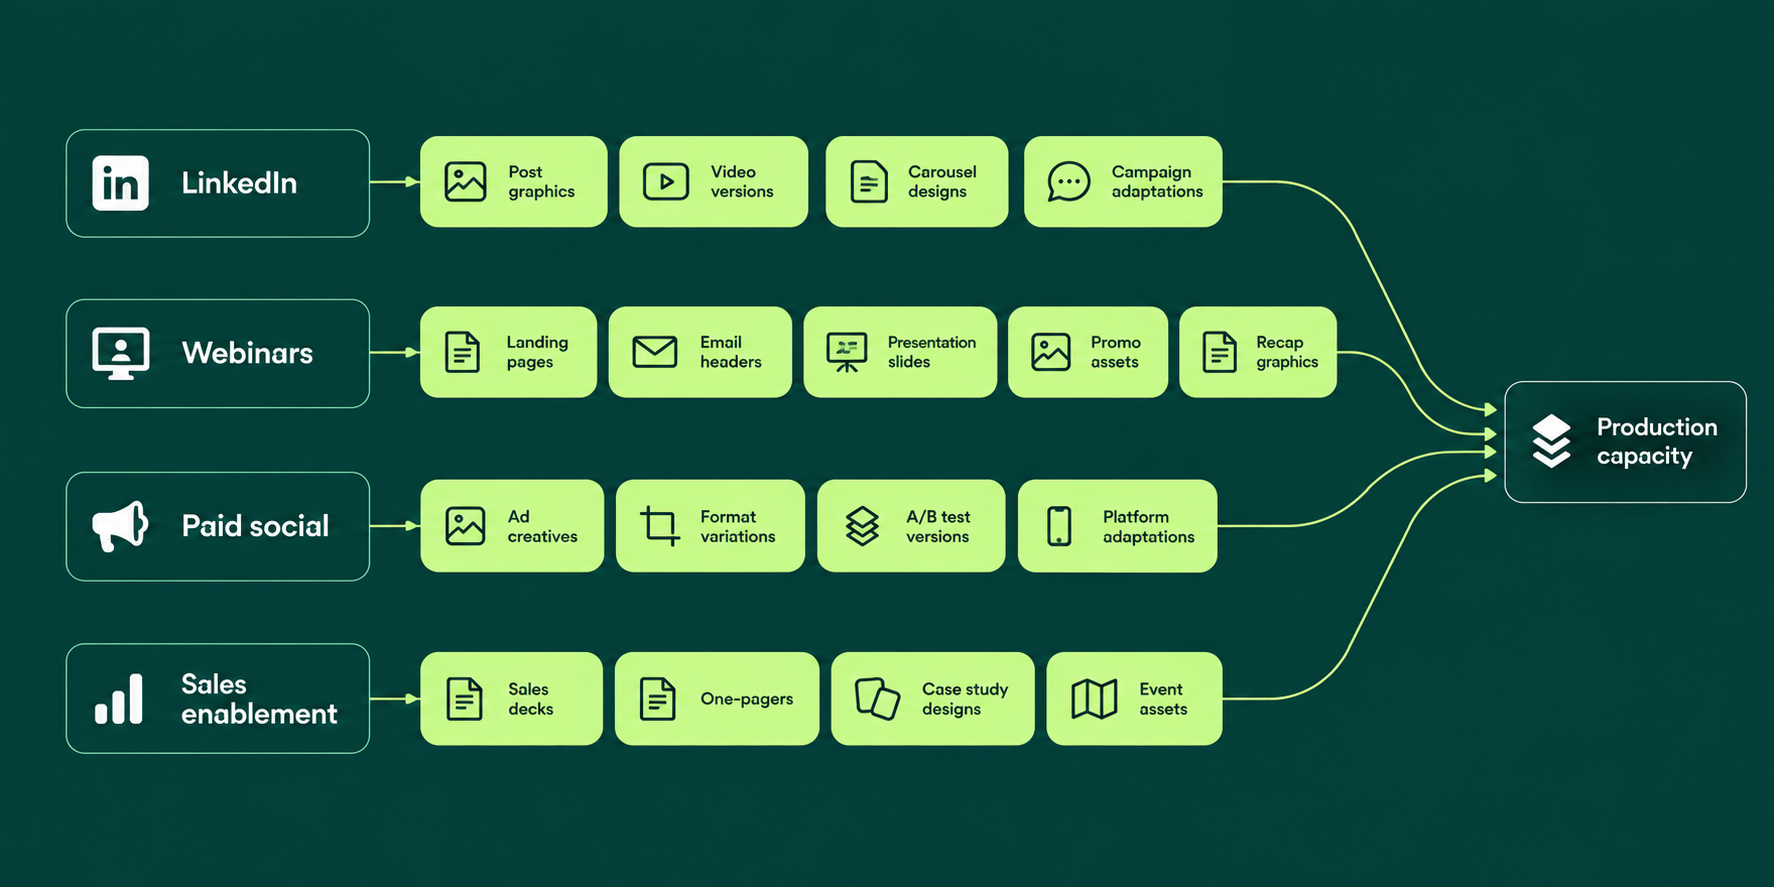
Most "how to scale marketing" advice is a menu of channels: SEO, social, paid, automation. What it skips is that every channel is a recurring stream of assets. A webinar series is landing pages, email headers, slides, promos and a recap graphic, every single month. A paid program means variants in every size the platforms ask for. Someone has to make all of it.
And budgets aren't growing to cover it. Gartner's 2026 CMO Spend Survey found marketing budgets flat at 7.8% of company revenue (7.7% in 2025), with 54% of CMOs saying they lack the resources to deliver this year's strategy. More output lands on the same people.
The four numbers: demand, effort, capacity, queue age
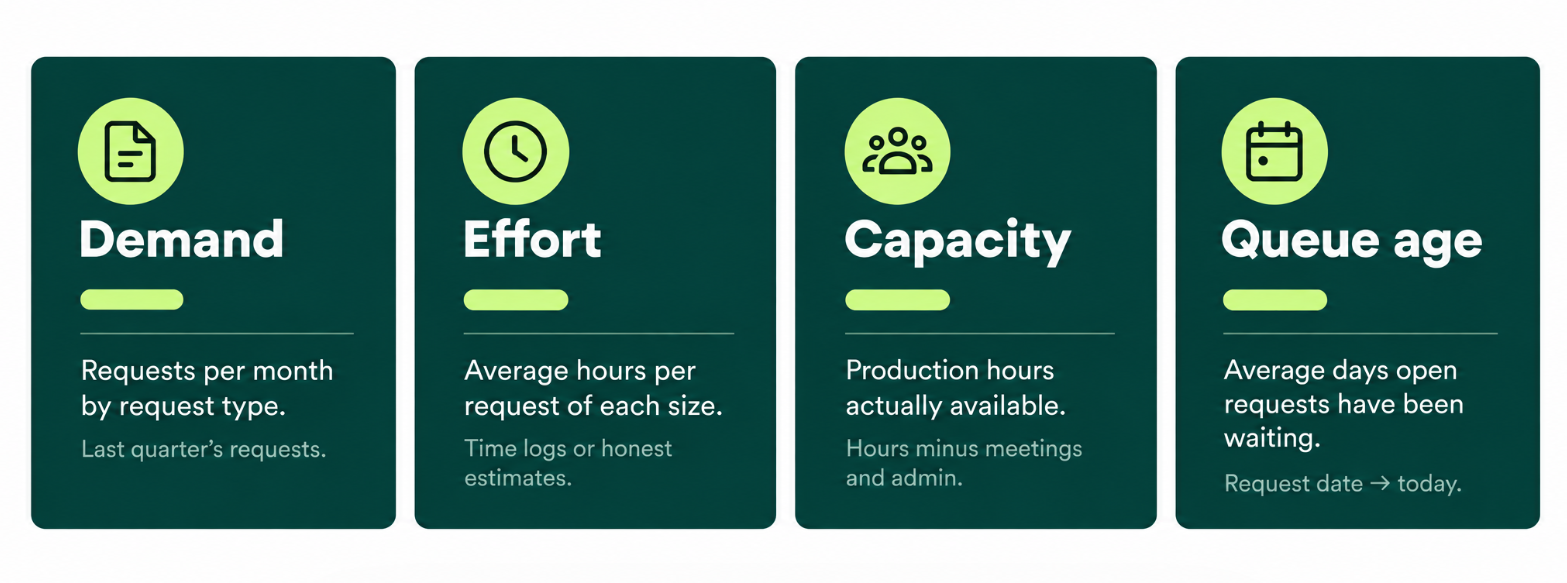
Last quarter's requests are enough to estimate all four.
• Demand: requests per month, split into quick updates (resizes, text fixes, format adaptations), standard requests (a new piece on an established brand) and complex projects (a new direction, a campaign system, a website).
• Effort: average hours per request of each size, revisions included. Use your own averages; they vary a lot between teams.
• Capacity: production hours actually available. Take monthly hours and remove meetings, admin and chasing files. Be honest. The model depends on it.
• Queue age: how many days open requests have been waiting, on average. It's the number your stakeholders feel every week.
The free capacity model sheet does the math and estimates how long a new request will wait. If that estimate is close to the queue age you measured, the model matches reality.
Reading the model: where your cap actually is
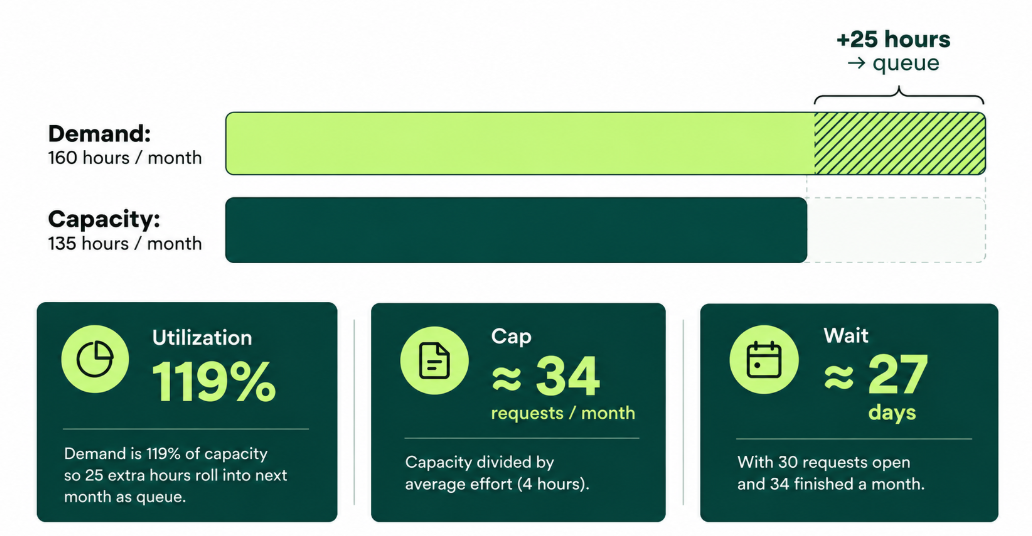
Take an illustrative lean SaaS team: one in-house designer plus a freelancer. They get 40 requests a month (24 quick updates at 1.5 hours, 12 standard at 5, 4 complex at 16). That's 160 hours of demand. Capacity is 135 hours: 70% of the designer's 150 hours, plus 30 from the freelancer.
Utilization: 119%. The 25 extra hours don't disappear. They roll into next month as queue.
The cap: about 34 requests a month. Capacity divided by average effort (4 hours). Demand is 40, so six requests a month join a line that never clears.
The wait: about 27 days. With 30 requests open and 34 finished a month, that's how long a new request sits. The math is Little's Law, proven by John Little in 1961: time in a system equals items in it divided by the rate they leave. When stakeholders say design is slow, this is what they mean. The designer isn't slow. The line is long.
And queues don't grow politely. Near 100% utilization, waiting time climbs much faster than workload, so one launch can set a team back for weeks.
The four levers, in the order they should be pulled
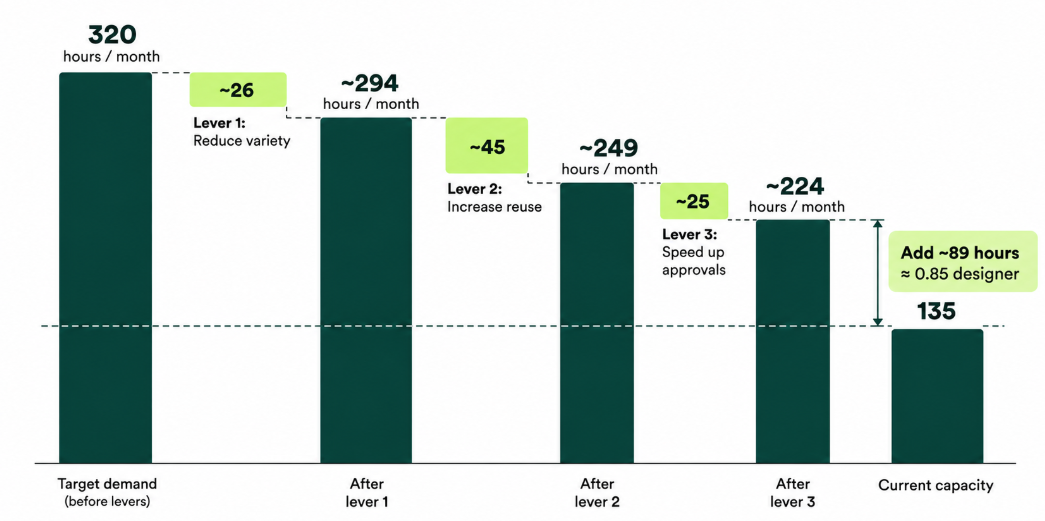
Doubling output means 320 hours of demand against 135 of capacity: almost two more designers. Pull the cheaper levers first and that number shrinks. (The percentages are illustrative; use your own in the sheet.)
Lever 1: Reduce variety
Much of a queue is variation, not new work: the eighth size of the same banner, a one-off format nobody will reuse. Retire what you don't need. Cutting 20% of quick updates and 10% of standard requests: 320 → about 294 hours.
Lever 2: Reuse
Templates and approved parent assets turn production into adaptation. The first webinar promo is design work; the twelfth should be an update. Saving 30% of effort on quick updates and 25% on standard: about 249 hours.
Lever 3: Cut approval time and avoidable rework
Late stakeholders, feedback in three channels, two versions and nobody sure which was approved. Exploring directions is real work; that kind of rework isn't. Remove half of it (say it's 20% of hours) and you're at about 224. The fix: one approver per request, with feedback, versions and sign-off living on the request itself.
Lever 4: Add capacity
Now the gap is about 89 hours a month: 0.85 of a designer instead of 1.76. A very different conversation with leadership.
What changes first when request volume spikes
In our experience, queue age moves before anyone reports a problem. And when a client's volume jumps, the first thing a Bespire Success Manager changes is rarely the number of designers. It's the queue: confirming what's really due, grouping variants into one job, pulling missing files and approvers forward, and being clear about what moves when something urgent jumps the line.
Because every request's chat, files, versions, feedback and approval live in one platform, those trade-offs are visible to everyone, not negotiated in DMs.
When a client's request volume roughly doubled, the Success Manager didn't add capacity first,they looked at what was actually in the queue. Some requests could be combined into a single brief, others were incomplete and waiting on the client, and a few didn't need to be produced at all. Clearing that out freed up capacity before adding more production support was even necessary.
Planning next year's output honestly: a worked example
For the example team, the December plan stops saying "we need more people" and starts saying:
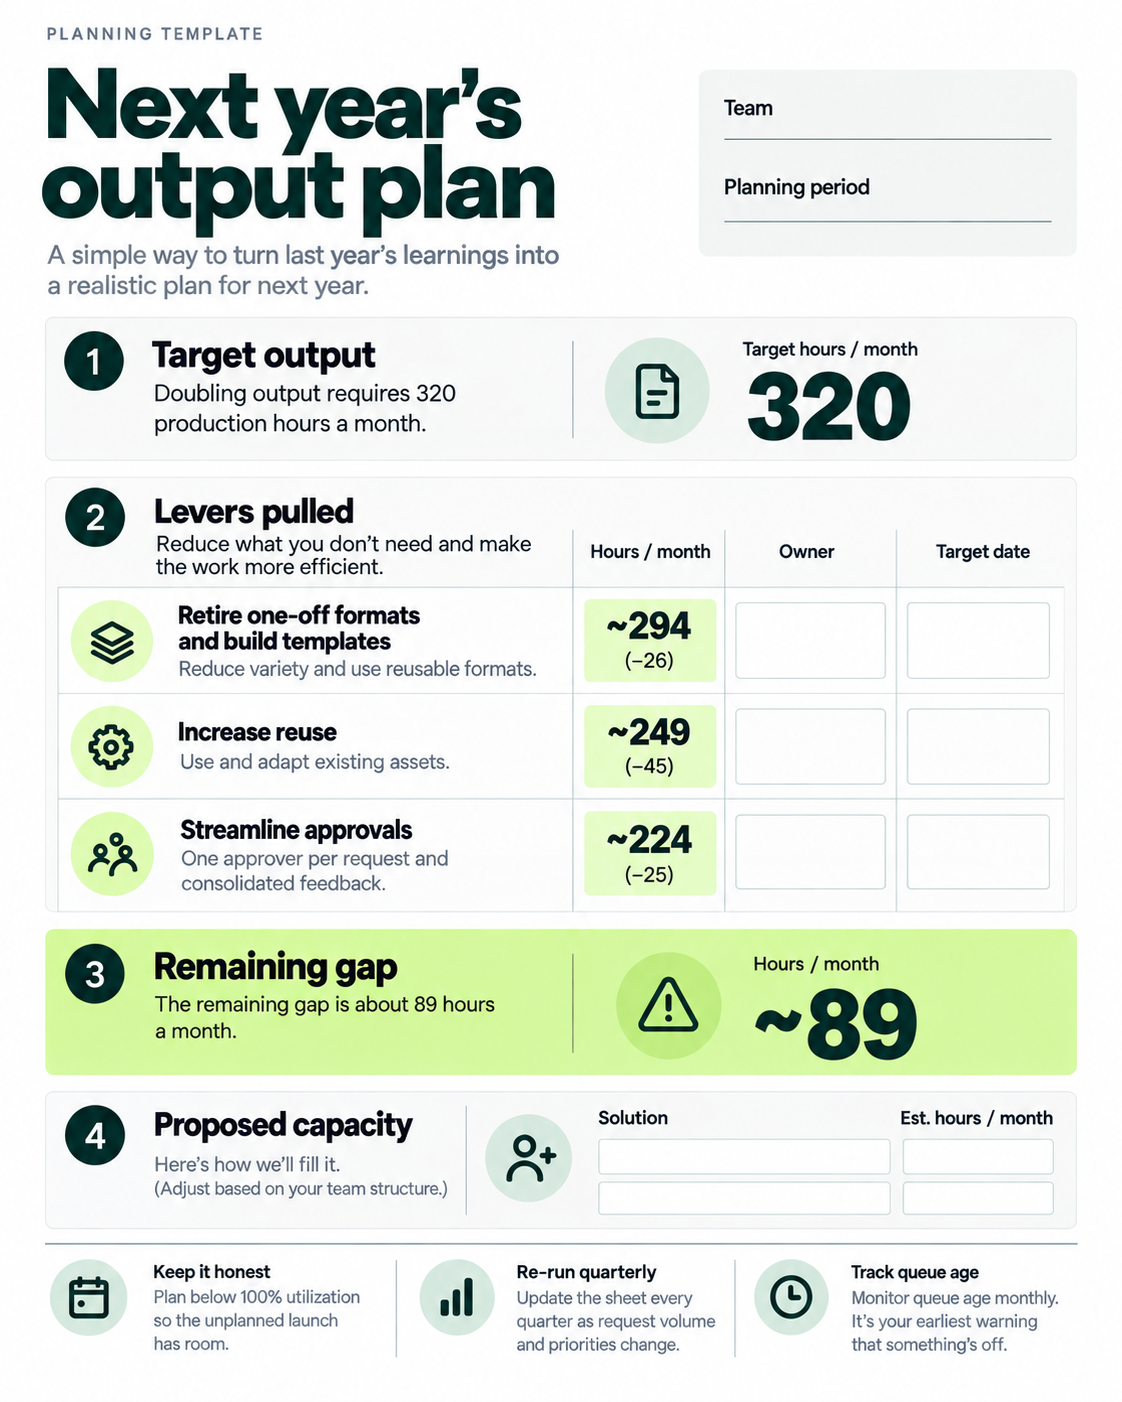
1. Doubling output requires 320 production hours a month. We have 135.
2. Retiring one-off formats and building templates brings that to about 249.
3. One approver per request and consolidated feedback bring it to about 224.
4. The remaining gap is about 89 hours a month. Here's how we'll fill it.
Then keep it honest: plan below 100% utilization so the unplanned launch has room, re-run the sheet every quarter, and track queue age monthly. It's your earliest warning.
When to add capacity, and in what form
• Overtime: covers a week. Over a year, it costs you the designer.
• Freelancers: good for specific skills or overflow, but each one adds briefing and coordination to your plate.
• A second in-house hire: right for steady, product-close volume and a design function you plan to grow. Slower to start.
• A project agency: right for a defined, high-stakes project. A poor fit for the weekly stream.
• Bespire: built for recurring, varied volume. A Success Manager runs the queue, a creative team produces the work, and one platform keeps every request connected. More capacity, no extra management layer.
Whatever you choose, check what it covers. The asset consumes creative capacity. Making the asset possible consumes operational capacity. Cover only the first and the gap comes back.
Show the number, not the stress
Planning goes badly when the marketing lead brings a feeling and leadership brings a target. Four numbers turn the feeling into a gap. The levers turn the gap into choices. Most of them are cheap, and by the time you reach the one that isn't, you'll know exactly what you're buying.
Frequently asked questions
How do you scale marketing without hiring more people?
Treat it as a production problem. Measure demand, effort, real capacity and queue age, then reduce variety, reuse templates and cut avoidable rework before adding anyone. Whatever gap remains is the capacity you actually need.
How do you calculate a marketing team's creative capacity?
Add the monthly hours of everyone who produces creative work and subtract meetings, admin and coordination. Compare that with demand: requests per month times average hours per request, revisions included. Anything above capacity becomes queue.
What is a good utilization rate for a creative team?
There's no universal number, but running near 100% is a mistake. Waiting times rise much faster than workload as a team approaches full capacity. Leave room on purpose and track how long open requests wait.
What is content velocity?
The rate at which content moves from request to publication. It depends less on how fast people work than on queue size, effort per request and approval time. Little's Law links them: time in the system equals work in progress divided by throughput.
When should a marketing team outsource creative production?
When a real capacity gap remains after cutting variety, reusing templates and fixing approvals, and the work is recurring. A managed execution layer like Bespire fits recurring volume; a project agency fits a single high-stakes project.
Where to go from here
Download the free capacity model sheet, fill in the yellow cells with last quarter's numbers, and bring the result to your planning meeting.
Want us to run it with you? Book a capacity review. We'll look at your queue, request mix and approvals and show you where your cap is. If the answer is more capacity, Bespire gives you a Success Manager, a creative team and one platform for requests, files, feedback, revisions and approvals.
If your bottleneck is strategy, or you only need one project done, the sheet will show that too, and Bespire probably isn't your next step.